Causal Graph AI for Strategic Planning: An Introduction
Every strategic planning model is a theory of causation. Most teams just don't know it. When your CFO says "if oil hits $120, we raise prices by 4%" — that's a causal claim. The question isn't whether you're doing causal reasoning. It's whether you're doing it explicitly, with traceable logic, or implicitly, with assumptions baked into spreadsheet cells nobody audits.
Why Causal Graphs Beat Correlation Models
The 2022-2023 inflation cycle exposed the limits of correlation-based forecasting in ways that are still being processed by enterprise risk teams. Correlations between CPI and input costs that held for 15 years broke down. Teams running correlation models couldn't explain why — only that their forecasts were wrong. Teams with explicit causal models could point to the mechanism: pandemic-era fiscal stimulus → demand surge → supply chain capacity exhaustion → shipping costs up 400% year-over-year → goods inflation with a six-month lag.
Fact: correlation tells you what moved together in the past. Causation tells you what will move what in a novel situation. For geopolitical risk, where you're frequently dealing with genuinely unprecedented events, correlation models are nearly useless. You need causal graphs.
The Anatomy of a Strategic Causal Graph
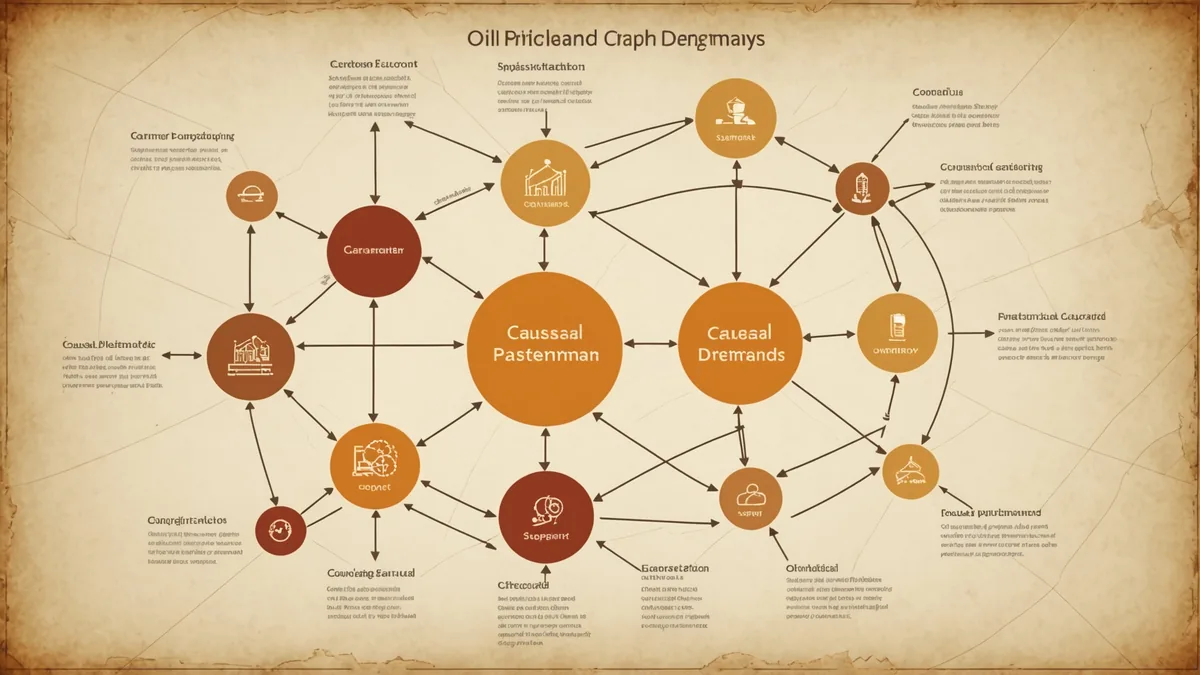
A causal graph in the strategic planning context is a directed acyclic graph (DAG) where nodes represent variables and edges represent causal relationships with direction and estimated strength. That sounds technical. In practice, it looks like a structured map of your business theory.
For a company with significant TSMC exposure, a simplified subgraph might encode: Taiwan geopolitical tension level → TSMC capacity allocation to non-US customers → lead times for 3nm and 5nm processes → Apple and Nvidia supply priority → available allocation for tier-2 customers → your product release schedule → your revenue timing. Each arrow represents a causal mechanism, not just a historical correlation. Each relationship has an estimated lag and a probability weight.
What makes causal graphs powerful for AI is that they provide the structural scaffold for reasoning about counterfactuals. Simple as that. Without structure, AI systems hallucinate plausible-sounding connections that don't actually hold.
Building the Graph: Interview Protocols That Work
In our experience, the hardest part of building an initial causal graph isn't the software. It's extracting the implicit causal theories from the humans who run the business. Every VP of Supply Chain has a mental model of how their supply network responds to shocks. Getting that model out of their heads and into a structured format requires specific interview protocols.
The approach that works: start with the most consequential strategic uncertainties ("what's the $500M scenario that keeps you up at night?") and work backward. Ask not "what do you think will happen" but "what would have to be true for that to happen, and what would follow from it?" Run three to five sessions with functional leaders. Expect contradictions between their models — those contradictions are your most valuable data, because they reveal where organizational knowledge is fragmented.
AI's Role: Maintaining and Updating the Graph
Once you have the initial causal graph, the AI's primary job is three things: monitoring for events that should trigger graph updates, propagating new information through the graph to update probability weights, and flagging when external evidence contradicts the graph's current structure.
The Russia-Ukraine war that began in February 2022 is a useful case study. Companies with causal graphs encoding European energy infrastructure → natural gas supply → industrial production capacity in Germany and Eastern Europe could propagate the February 2022 invasion signal through to European manufacturing exposure in hours. Companies without that structure spent weeks running analyst meetings trying to understand their exposure.
Our data shows that AI-assisted graph updating reduces the time from "major geopolitical event" to "updated strategic risk assessment" from roughly 45 days (traditional consulting process) to under 72 hours. That 40x speed improvement compounds across every event in a year.
Probability Weighting: How Confident Should You Be?
Here's where teams run into philosophical trouble. Assigning probabilities to causal relationships feels artificial. How do you put a number on "CHIPS Act restrictions → Chinese semiconductor industry acceleration"? Our answer: imprecise probabilities are more useful than no probabilities, provided you're transparent about the uncertainty.
We typically assign probability weights in ranges rather than point estimates: "60-75% probability over 24 months" is more honest than "68% probability" and more useful than "significant chance." The range communicates both the direction and the confidence level. For novel geopolitical events without historical base rates, we use structural analogs — finding the closest historical parallel (e.g., US semiconductor export controls to the Soviet bloc in the 1980s) and adjusting for contextual differences.
Validation: Testing Your Causal Graph Against History
Before trusting a causal graph for forward-looking decisions, you need to validate it against historical events. This is called "backtesting" in quantitative finance; in strategic planning, it's less common but equally important. Pick three to five significant events from the past five years — COVID-19 supply chain impact, Russia-Ukraine energy shock, CHIPS Act passage, Houthi Red Sea attacks in late 2023 — and run them through your graph. Did the graph predict the right direction of impact? Did the lags roughly match what actually happened?
Every failure in backtesting is a graph refinement opportunity. Real talk: expect 30-40% of initial causal links to need adjustment after backtesting. That's normal. It means the validation process is working. Teams that skip backtesting and go straight to forward-looking use tend to discover the same 30-40% error rate under live-fire conditions instead, which is far more expensive.
From Graph to Decision: Closing the Loop
A causal graph is only useful if it connects to decisions. The final step in any causal AI implementation is mapping graph outputs to the specific decisions your strategy team needs to make: capital allocation timing, supply chain diversification investment thresholds, hedging instrument selection, M&A timing relative to geopolitical cycles.
We've found that teams who explicitly map "graph output X triggers decision review Y" before deployment are three times more likely to actually use the system in real decision cycles than teams who build the graph and then figure out how to use it later. The connection to decisions has to be designed in, not bolted on afterward. For more on how Principle structures these decision frameworks, visit our platform overview or about page to learn about our methodology development work.